Asthma management isn’t only about reacting to symptoms. It is actually about noticing the small changes that happen in your lungs before wheezing or breathlessness begin. A peak flow meter chart gives you those clues in numbers, turning invisible airway changes into measurable signals you can track at home.
This becomes especially important during India’s monsoon season, when humidity, damp surroundings, and hidden mould quietly trigger breathing difficulties. Reading your peak flow meter chart the right way can help you detect early dips, spot patterns, and act before a full flare-up develops. But how to really read and understand them?
In this guide, we’ll walk through all the values you’ll see on a peak flow meter chart. We will also share steps to use your asthma monitoring device in India correctly, and highlight how to chart your results to link them with seasonal patterns.
Manual vs. Digital Peak Flow Meters: Understanding the Differences
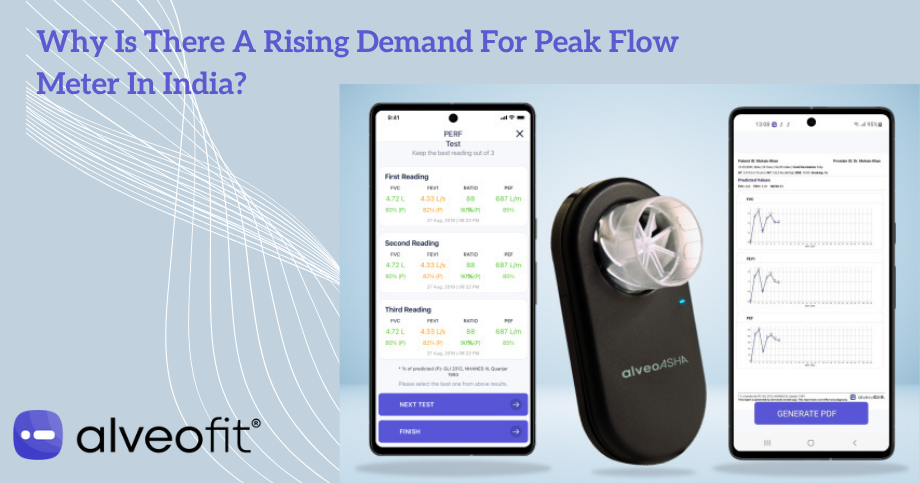
If you are living with asthma or another breathing condition, your doctor may have recommended using a peak flow meter at home. These devices are small, portable, and designed to measure how well your lungs are working on a daily basis. When exploring to purchase one, you may however come across two different types of peak flow meter in India, including a manual and a digital peak flow meter.
Some people prefer the traditional manual peak flow meter, while others use modern digital versions. Both of these monsoon asthma management devices measure the strength of your breath, but they do it in very different ways and offer different levels of detail.
-
Manual Peak Flow Meters
A manual peak flow meter is the “traditional” device that has been in the market for decades. It is usually made of lightweight plastic and has a numbered scale with a small sliding marker.
How to use a manual peak flow meter:
All you need to do to use it, is take a deep breath, place the mouthpiece in your mouth, and blow out as hard as you can. The force of your breath pushes the marker on the asthma monitoring device along the scale. The number the market stops at becomes your reading. This number represents your Peak Expiratory Flow, often written as PEF, and it is measured in litres per minute.
How can a manual peak flow meter benefit you:
The biggest advantage of a manual peak flow meter is its simplistic design and use. It gives you one clear reading that you can record in a diary or chart. You can see whether your airways are narrowing or if your lung function is stable by comparing this number with your personal best over time. Moreover, manual peak flow meters are sturdy, affordable, and do not need any battery to work. This makes them especially practical for children or for people who only need a basic way to track their asthma control.
What are limitations of manual peak flow meter:
However, it is important to understand the limitations of using such a device for home asthma check in India. A manual meter only measures PEF. It does not record other useful values like Forced Expiratory Volume in one second, often called FEV1. It also does not store your readings or generate charts automatically. Everything has to be tracked by hand, which means you only get a snapshot of your lung function each time you blow into it.
-
Digital Peak Flow Meters
Digital peak flow meters take the same basic concept and build on it with technology. Instead of using a physical marker, these devices rely on electronic sensors that calculate your results.
How to use a digital peak flow meter:
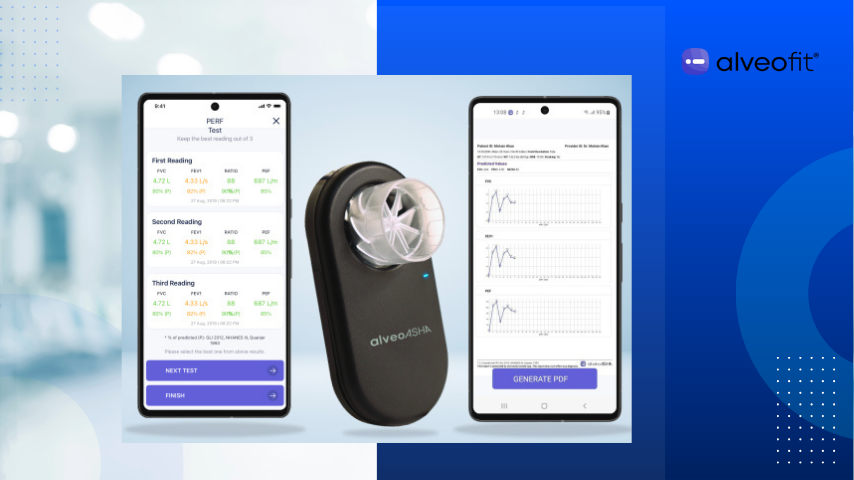
You simply have to blow into the device and your readings will appear instantly on a digital screen. Many digital models can also connect to smartphone applications, where your results are stored and displayed as easy-to-read graphs. This makes it much simpler to notice trends or share your data with your doctor during follow-up visits.
How can digital peak flow meter benefit you:
A digital meter does more than just show your PEF. Many models of such an asthma monitoring device in India also measure FEV1. This is a really important value that tells the user about the amount of air they can exhale within the first second of a strong breath. Some advanced versions of portable peak expiratory flow meter can even calculate averages across multiple attempts. Such devices will highlight small changes in your breathing that you may not notice. Moreover, they keep long-term records of these changes that could later help in managing your condition more closely.
Does a digital peak flow meter have any challenges:
Digital meters also come with certain challenges. They need batteries to work, and if the power runs out, the device cannot be used until recharged or replaced. Some models such a monsoon asthma management device require syncing with apps. Although highly beneficial, it can also make the process a little more complicated, especially for those who prefer straightforward results. In addition, the extra information they provide may sometimes be confusing without proper medical guidance.
What Do the Different Values Within a Peak Flow Meter Chart Mean?
When you use a peak flow meter, the device gives you numbers that reflect how well your lungs are working. The specific values you see within the peak flow meter chart will however depend on whether you are using a manual device or a digital one. A manual peak flow meter usually only shows just one main number on the device. On the contrary, a digital peak flow meter mostly provides two or even three additional details.
To understand your readings clearly, it is important to know what each value in a peak flow meter chart actually means:
-
Peak Expiratory Flow (PEF)
The most common value you will see on a peak flow meter chart is called Peak Expiratory Flow, often written as PEF. This reading is expressed in litres per minute and shows how fast you can push air out of your lungs in one strong breath. A higher number generally means that air is moving more freely, while a lower number suggests that your airways may be narrowing. Doctors usually recommend tracking this number every day, because it helps you notice early changes in your breathing, even before symptoms like coughing or wheezing appear.
-
Forced Expiratory Volume in One Second (FEV1)
If you are using a digital peak flow meter, you may also see another important value called Forced Expiratory Volume in one second, or FEV1. This measures the amount of air you can blow out in the first second of a forceful breath. It is a very sensitive marker for airway obstruction and helps in understanding how quickly your asthma might be worsening. While PEF gives you the speed of airflow, FEV1 shows you the actual volume of air that passes out. A portable peak expiratory flow meter hence adds another useful dimension to your peak flow meter chart.
-
Average or Predicted Readings
Some digital devices also provide an average score or a predicted value. Predicted values are calculated based on factors like your age, height, gender, and sometimes ethnicity. They give you a general reference point, but they are not as important as your personal best. Your personal best reading is the highest PEF that you achieve during a test in times when your asthma is under good control. Comparing your daily numbers to your personal best on your peak flow meter chart is far more meaningful than comparing them to a predicted average.
-
Percentage of Personal Best
Many portable peak expiratory flow meter, especially digital ones, also show your readings as a percentage of your personal best. For example, if your best PEF is 400 and today’s reading is 320, the device may display it as 80 percent. This percentage makes it easier to place your results into the green, yellow, or red zone of your peak flow meter chart. The zones simplify your numbers into action steps, helping you and your doctor decide whether you are in control, need to adjust medication, or require urgent care.
Why Each Value on the Peak Flow Meter Chart Matters?
Each value on your peak flow meter chart has a role in painting the bigger picture of your lung health.
- PEF tells you how tight or open your airways are at that moment.
- FEV1 helps you understand the depth of obstruction and how quickly symptoms may progress.
- Percentages of your personal best bring clarity by breaking the results into zones. This acts as a guide to your asthma flare‑up prevention plan during monsoon.
When combined, these numbers create a complete overview that goes beyond a single reading.
Linking Peak Flow Meter Chart Values to Monsoon Patterns
Monitoring becomes even more important during the monsoon season in India. Humidity, damp bedding, and hidden mould often make asthma symptoms worse, and these triggers are reflected in your peak flow meter chart.
- You can notice your PEF values dipping by 10 to even 20 percent compared to your personal best for several days in a row during rainy season.
- Some people find their evening PEF readings consistently lower than their morning readings, which can point to night-time triggers.
- Others see sudden drops in morning values, suggesting that allergens or poor ventilation are affecting them overnight.
These early dips in your peak flow meter chart are warning signs, even if you are not feeling short of breath. They show that your airways are already reacting to seasonal triggers long before you feel noticeable discomfort. Moreover, spotting these changes in time allows you to act early, adjust your management plan with your doctor’s guidance, and reduce the risk of sudden flare-ups.
Correct Technique to Get Accurate Readings on Your Peak Flow Meter Chart
Simply knowing what the values on a peak flow meter chart mean is not enough. You must also need to use the device correctly to get accurate and reliable results on your peak flow meter, That is why it is crucial to understand the right method of using portable peak expiratory flow meter:
- Sit or stand upright. This allows your lungs to have plenty of space to expand properly.
- Before every attempt, make sure to slide the marker back to zero.
- Take a deep breath, place the mouthpiece in your mouth, and seal your lips tightly around it.
- Blow out in the peak expiratory flow meter once, as hard and fast as you can. Avoid giving small puffs or repeating blows in the same attempt.
- Repeat the test three times and write down the highest reading. This number represents your most accurate result for that moment.
For the best comparison, it is always smart to check your peak flow meter chart at the same time every day during the year. The ideal time to take an asthma monitoring test is usually in the morning before using your quick-relief inhaler. This way, you will capture your baseline lung function without the temporary boost that medication can provide.
Making Sense of the Zones on Your Peak Flow Meter Chart
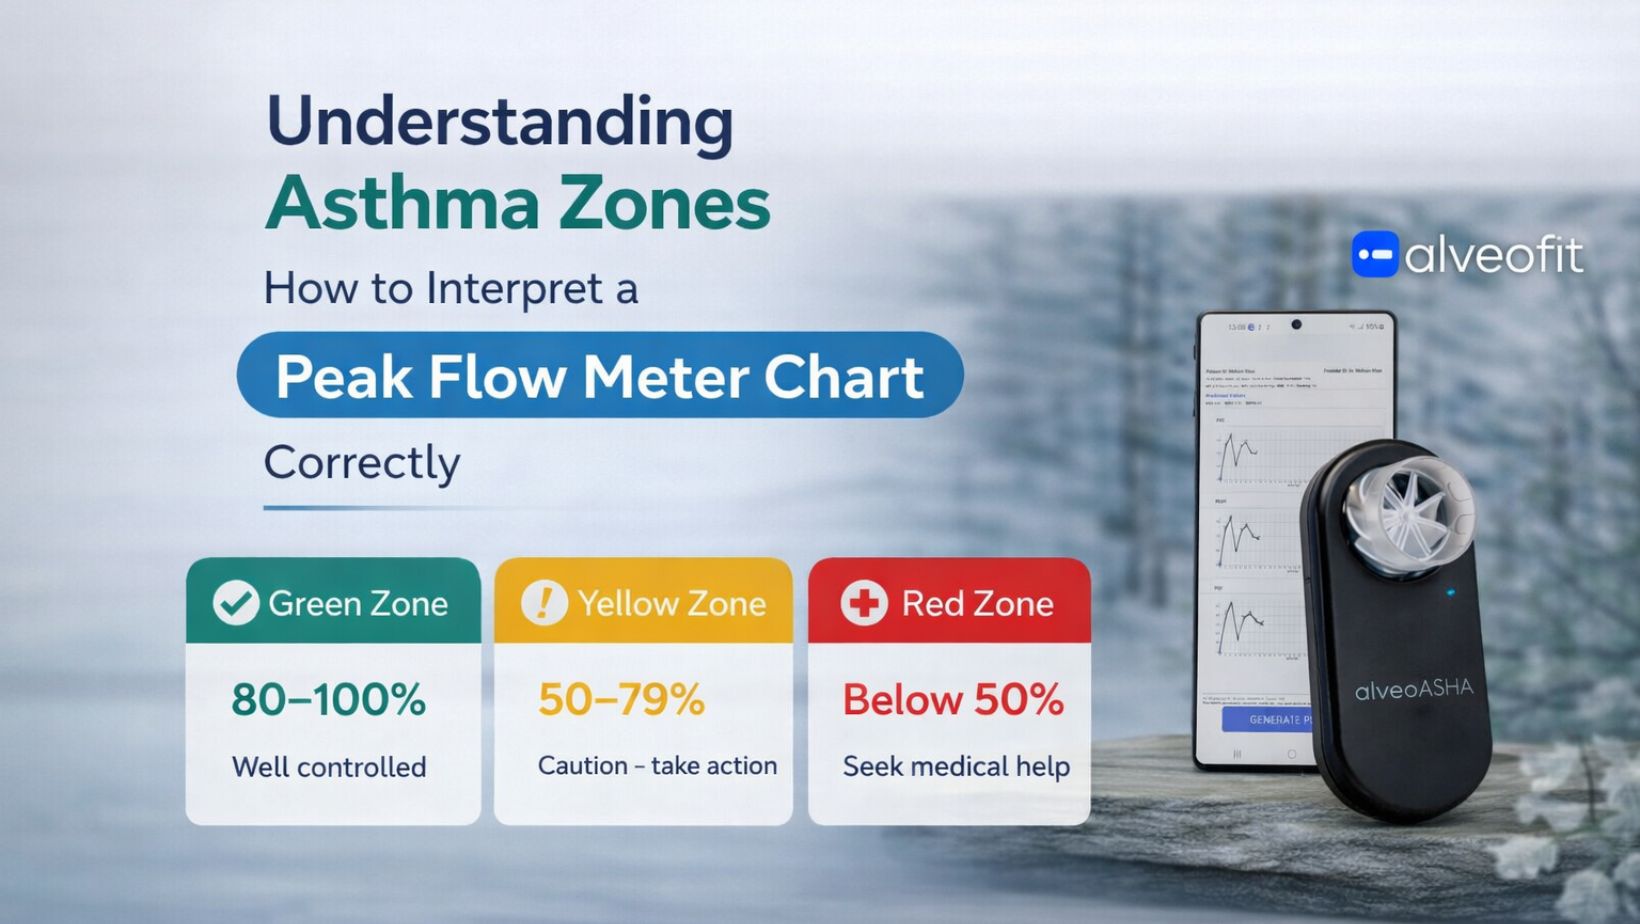
Find your personal best using your monsoon asthma management tool. Once you do, each new reading can be compared against it and placed into one of three colour-coded zones on your peak flow meter chart. These zones act like traffic signals for your lungs, telling you when things are under control and when it’s time to take action.
- Green Zone (80–100% of personal best): Your breathing is stable, and your asthma is well managed.
- Yellow Zone (50–79% of personal best): This is a warning sign. It signals that your airways are starting to narrow, and you may need to adjust your medication or watch out for possible triggers.
- Red Zone (below 50% of personal best): This is an emergency. Red zone points out that your lungs are significantly obstructed, and you should seek medical help immediately.
For example, if your personal best is 450 L/min:
- Getting Reading of 360–450 L/min: Means you are in safe range (green).
- Getting Reading of 225–359 L/min: Points to the range where you should be cautious (yellow).
- Getting Reading Below 225 L/min: States that urgent action are needed (red).
By noting these zones on your peak flow meter chart, you get an easy-to-read system that guides both you and your doctor in managing your asthma more effectively.
Charting Readings to Detect Trends During Monsoon
Taking the test once in a while may give you a number, but recording your readings daily is what makes your peak flow meter chart truly powerful. A single result may not mean much, but when you track your numbers over days and weeks, a clear pattern begins to emerge.
Here’s how you can make charting more effective:
- Write down both morning and evening readings to spot variations.
- Mark any yellow or red zone values clearly.
- Add short notes when you suspect a trigger, such as “rainy day,” “exposed to dust,” or “slept on damp bedding.”
Over time, your peak flow meter chart becomes more than just numbers! It actually becomes a map of how your lungs respond to daily life and during seasonal changes, such as during monsoons. For example:
- Frequent yellow-zone readings during humid weeks may point toward mould at home.
- A steady decline in values over several days may suggest that your overall asthma control is slipping, even if you do not feel unwell yet.
By spotting these trends early, you and your doctor can adjust your treatment before symptoms get worse. This is especially important during the monsoon season, when asthma flare-ups are more common. With consistent charting, your peak flow meter chart acts as an early warning system, helping prevent sudden attacks and reducing the risk of hospital visits.